Monday, March 14, 2011

Gender pay

Gender pay gap not so insidious


THE push for boardroom gender quotas is starting to look like a vested interest group seeking government favour.

Labor chose last week's 100th anniversary of International Women's Day to ramp up the threats against businesses that don't "actively pursue gender equality in the workplace". It even attracted political support from Governor-General Quentin Bryce for female quotas on corporate boards.

Minister for the Status of Women Kate Ellis blamed business for the "insidious structural and cultural barriers" facing women. She announced "regular spot checks" by a beefed-up Equal Opportunity for Women in the Workplace Agency to keep all businesses with more than 100 employees "honest".

Government would refuse to do business with companies that failed the gender equity test. "No more good intentions," Ellis said. "We want good outcomes."

Ellis started to lurch into heavy-handed regulation rather than just naming and shaming, paid parental leave, mentoring programs for female executives or even allowing them to import their own nannies. There was none of the rigorous scrutiny that Productivity Chairman Gary Banks has urged for Labor's re-regulation of the job market.

And Ellis ignored the likelihood that workforce gender gaps stemmed more from women and men's differing choices than from insidious structural and cultural barriers that business supposedly maintained.

She began with the "fundamentally unfair" 17 per cent gender pay gap: basically the extra wages earned by male full-time workers compared with female full-time workers. But Australia has the sixth lowest gender wage gap of 20 countries belonging to the Organisation for Economic Co-operation and Development. We're on par with Sweden, lower than the US and Germany, and much lower than Japan. And this gap partly reflects the four extra hours that Australian men working full-time clock up each week compared with full-time female workers. Take this out, and the gender pay gap narrows to 11 per cent an hour.

The gap has widened amid the surge in high-wage mining boom jobs that are overwhelmingly filled by men. But, even then, the gender pay gap reflects entrenched male and female "lifestyle choices" after they form families. Most women break or reduce their job patterns when they have children, which reduces their experience, career prospects and earning potential.

Hence, there is no gender wage gap for under-30 workers. For older workers, there is virtually no gap between men and childless women.

Yet a Productivity Commission paper released two months ago notes that the gender gap has not discouraged women aged over 45 from penetrating the workforce more rapidly than any other cohort in the past generation. Mature women earn a sizeable premium for their tertiary qualifications. When they work full time, they get promoted more rapidly than mature-age men. Yet mature-age women strikingly still prefer part-time and casual work more than mature-age men do. On average, they put in no more hours today than a generation ago. While all women fill 45 per cent of jobs, women working full time account for 28 per cent of hours worked.

Part-time and casual workers don't suffer a wage penalty. But they do wear a promotion penalty. It's hard to be promoted up the management ranks to the executive suite juggling part-time work while being the primary family carer.

The bad outcomes identified by Ellis fit more comfortably with the work of John Howard's favourite sociologist, Catherine Hakim. The London School of Economics senior research fellow suggests that 10 per cent to 30 per cent of women are "home-centred" and prefer not to work; 40 per cent to 80 per cent are "adaptive" and want to work without being totally career committed; and 10 per cent to 30 per cent are "work-centred" with their jobs being their main priority in life.

The Productivity Commission suggests that Hakim's breakdown is supported by the "broad stability over the past two decades" in the household division of labour. As in the early 1990s, women on average still spend nearly twice as many hours a day than men doing housework, shopping and looking after children "despite considerable social and demographic changes". This entrenched division is one of the main factors behind the gender work imbalance.

Yet the Productivity Commission notes that 68 per cent to 73 per cent of mature-age female workers are "very satisfied" with their remuneration. Three-quarters are very satisfied with their job flexibility. Although some want more work, part-time working women are most satisfied with their hours. And women in full-time jobs would rather work less. If the preferences of all mature-age female workers were met, they would spend 10 per cent less time on the job.

If all this is unsatisfactory on equity grounds, boardroom gender quotas for some of society's most highly paid workers are not an obvious place for a Labor government to focus. If it's about efficiency, then Labor should convince the shareholders' association and superannuation funds that investors would generate more profit by voting well-qualified women on to boards. Rather than unleashing the workplace gender cops, Ellis should make equal opportunity part of a genuine push to raise the productivity and flexibility of Australia's over-regulated and sometimes blokey workplace culture.

Any serious policy response needs to recognise that many women make their own choices about balancing family preferences with the prospect of being a company executive on call 24 hours a day well into their 50s. Yet senior business executives are the main pool from which board members are rightly drawn.

The danger in trying to resolve this tension through quotas was revealed in the round table of directors reported in The Weekend Australian on Saturday. Reflecting the unease, Medibank and IOOF board member Jane Harvey said the female directors got approached all the time by young women who wanted board positions. Harvey said: "Some of these young women . . . haven't actually achieved and made a name for themselves in their first career." They saw directorships "as a part-time job or something that fits in with the children and that sort of thing."

Monday, March 07, 2011

AGW voters guide

Quadrant article

The Intelligent Voter's Guide to Global Warming

Geoffrey Lehmann, Peter Farrell & Dick Warburton


Part 2 will be published in April Quadrant.


In a news story on March 20, 2000, “Snow falls are now just a thing of the past”, the UK’s Independent newspaper reported:

Sledges, snowmen, snowballs ... are all a rapidly diminishing part of Britain’s culture, as warmer winters—which scientists are attributing to global climate change—produce not only fewer white Christmases, but fewer white Januaries and Februaries ... According to Dr David Viner, a senior research scientist at the climatic research unit (CRU) of the University of East Anglia, within a few years winter snowfall will become “a very rare and exciting event ... Children just aren’t going to know what snow is”.

This millenarian prediction from the world’s most prominent climate research centre was a dud. When the news story appeared ten years ago, an unanticipated pause in global warming was already taking place, and global warming has not resumed since then. On January 7, 2010, a NASA satellite photographed the UK covered entirely by a blanket of snow. The published photograph shows the familiar shape of the map of England, Scotland and Wales, frozen white, and set in an ocean of dark blue silk, with the edges partly obscured by wisps of cloud. In the winter just ending, Britain underwent yet another winter of heavy snowfalls. On November 29 the Independent had a story headed, “Cold comfort for a Britain stuck in a deep freeze”.

With Julia Gillard’s sudden switch to support for a carbon price, Australia in 2013 could be the first country to hold an election with anthropogenic global warming (AGW) as the pivotal issue. If Tony Abbott is still Opposition Leader he will see an emissions trading scheme (ETS), or carbon tax, as a target that is as vulnerable as John Hewson’s GST proposal in 1993. At that time Abbott was Hewson’s press secretary, and Hewson was “cooked slowly” by Paul Keating in a protracted election campaign.

We have written this piece as an intelligent voter’s guide to global warming—to provide basic information often missing from the debate. In Part 1 we examine the science, and in Part 2 the practicalities of an ETS and carbon tax, and the politics. All three aspects—science, economics and the associated politics—intersect and drive each other.

I. The science

Man-made emissions are likely to cause a doubling of atmospheric carbon dioxide during this century and this increase will continue to have a warming effect on global temperatures. One of the disappointing distortions of the climate science debate is the claim that sceptics deny this relationship. What sceptics are sceptical about is the strength of this AGW effect. A strong AGW effect would be an increase in global average temperatures of 2.5 to 4 degrees or more, with potentially disruptive outcomes, such as a possible large rise in sea levels. A weak AGW effect would be an increase of 1 degree or less, a number of much less concern.

One of the constants of climate, like that day-to-day local phenomenon the weather, is its variability. We are living during a warmer period known as an interglacial, which began about 11,400 years ago. It is an “interglacial” because for the previous 2.5 million years, much of northern Eurasia and North America has been blanketed by kilometres-deep ice sheets. This ice age or glacial has been interrupted by warmer interglacials of from 10,000 to 20,000 years occurring at intervals of about 100,000 years.

These transitions—into and out of an ice age—are triggered by various, overlapping Croll–Milankovich cycles which change how much solar radiation our planet receives, and where. Croll–Milankovich cycles are due mainly to interactions with the gravitational fields of other planets, and shift the Earth’s orientation and orbit around the sun and can be precisely calculated backwards and forwards through time. The start of our interglacial was dramatic and occurred over a human lifetime.

The eccentricity of the Earth’s orbit is currently small and decreasing. This will continue for 30,000 years, which means that our current interglacial is likely to be exceptionally prolonged. By some lucky happenstance our civilisation sits in an astronomical sweet spot, and we probably have hundreds of generations to prepare for the likely return of an ice age.

Average temperatures during an interglacial are stabler than during a glacial. But over the last 5000 years there have been climatic changes severe enough to have disrupted a number of agrarian societies. As well as the Croll–Milankovitch cycles, there are variations in the output and nature of radiation from the sun itself. A solar cycle of about eleven years manifests itself visibly by sunspots. As the cycle reaches its maximum, sunspots become more frequent, and total solar irradiance increases slightly.

This difference in total solar output (only about 0.1 per cent) is regarded as insufficient in itself to cause climate changes of any significance. However, the sun’s short-wave radiation (from the ultraviolet through to x-rays) varies greatly and has significant effects on the earth’s stratosphere, the layer of air about ten to fifty kilometres above the Earth’s surface in temperate latitudes.

There is also a “solar wind” (a stream of charged particles), whose variable intensity may predict the intensity of the next solar cycle. The solar wind causes the spectacular displays of lights known as auroras and protects Earth’s atmosphere from cosmic rays from outside the solar system. It is argued controversially that cosmic rays (they are in fact particles, not rays), may trigger cloud formation and affect climate. Over the last 10,000 years, changes in solar activity and the nature of solar radiation (but not changes in total solar output) have most likely had significant climatic effects.

There was a Little Ice Age, from about 1300 until about 1850, typified by the freezing of the River Thames and a decline in European agriculture. This 550-year span is associated with three periods of low sunspot activity, known as minima. During these low sunspot periods, the solar wind is also less active, fewer auroras are observed and cosmic rays from outside the solar system cause the formation of carbon-14 in the atmosphere; this is detected in tree rings (as trees inhale carbon dioxide). Conversely, periods of high solar activity result in reduced carbon-14 levels in tree rings. Brian Fagan, an archaeologist, writes that tree rings show:

a well-defined fall in 14C levels and a peak in solar activity between about AD 1100 and 1250, the height of Europe’s Medieval Warm Period ... There is certainly a nearly perfect coincidence between major fluctuations in global temperature over the last 1000 years and the changes in 14C levels identified in tree rings. This implies that long-term changes in solar radiation may have had a profound effect on terrestrial climate over decades, even centuries.

There was an immediate temperature spike when the current interglacial began 11,400 years ago. Average temperatures at many sites from 8000 to 10,000 years ago were about 2 degrees warmer than now. Since then global average temperatures have gradually declined, with peaks and troughs, and variations from site to site. A central Greenland ice core shows a Minoan warming about 3500 years ago, a Roman warming about 2000 years ago, the Medieval Warm Period, and the twentieth-century warming, with each new warming being about 1 degree cooler than its predecessor. Richard B. Alley, who worked on this ice core, commented: “the best paleothermometers are probably those on the ice sheets”.

Ice cores, when available, are perhaps the best evidence of temperatures in the past, because the isotopic composition of a section from an ice core reflects just one main influence. This is the temperature of the air from which it condensed, as heavier molecules of water vapour (with more neutrons) are the first to condense when air chills. Climate scientists who argue for a strong AGW effect have tended to rely on less reliable proxy evidence such as tree rings (which may reflect a number of influences, for example the availability of such key nutrients as water) when claiming that recent temperatures are “hotter than ever”.

The pre-industrial level of atmospheric carbon dioxide was about 280 parts per million volume (ppmv). In the late 1940s this began a steady rise to the current level of about 390 ppmv. The steady graph of this year-by-year rise, with a small seasonal wobble as northern hemisphere plants inhale carbon dioxide in spring and summer, points to a single dominant cause—man-made emissions. To the extent that this is causing a greenhouse effect humans are responsible.

Carbon dioxide is transparent to most incoming solar radiation. But it is opaque to certain wavelengths of infrared or “black body” radiation and blocks the escape of this radiation into space from the sun-warmed surface of our planet. Hence the greenhouse effect. In the absence of positive or negative feedbacks, the doubling of atmospheric carbon dioxide would eventually raise global average temperatures by about 1 degree. The main qualifiers here are “eventually” and the role of feedbacks.

A majority of Western climate scientists, in predicting severe global warming, argue that there are positive feedbacks causing a strong AGW effect. As increased levels of carbon dioxide heat the atmosphere, atmospheric water vapour (humidity) increases. This water vapour is also a greenhouse gas, and is already far more plentiful than carbon dioxide. Increasing it will amplify the warming caused by increased carbon dioxide—perhaps by up to 5 degrees or more for a doubling of carbon dioxide, according to some general circulation models relied upon by the United Nations Intergovernmental Panel on Climate Change (IPCC).

However, other climate scientists argue that the feedbacks can be negative, so there is only a weak AGW effect. The relationship between a warming atmosphere and increased water vapour is complex. Increased water vapour will eventually condense, warming the air around it, as latent heat is released by the change from a gaseous to a liquid state. The condensed vapour may become low-level cloud, which has a cooling effect (as it reflects incoming radiation), or high-level cirrus cloud, which has an overall greenhouse effect.

Data from weather balloons (radio-sondes) suggest that with increased warmth at the planet’s surface, there may be less water vapour in the atmosphere above about three kilometres, where a positive feedback from water vapour might occur. It is also argued that high-level cirrus cloud cover, which blocks escaping radiation, decreases over tropical oceans as temperature increases. The IPCC’s Fourth Assessment Report of 2007 acknowledges: “Cloud feedbacks remain the largest source of uncertainty.”

The second qualifier about a doubling of carbon dioxide raising global temperatures is 1 degree “eventually”. The oceans and atmosphere have been described as unequal dancing partners, with the atmosphere reacting quickly and the oceans heavy-footed, slow and out of step.

Radiative or climate forcing is the net change in incoming and outgoing radiation energy in the climate. It is measured in watts per square metre. There is a positive forcing if, for example, an increase in greenhouse gases blocks outgoing radiation, and there is a negative forcing if, for example, reduced sunlight enters the Earth’s atmosphere as its orbit becomes more eccentric.

Oceans have about 200 times the mass of the atmosphere. They may take some hundreds of years to respond fully to an increase in radiative forcing (typically extra sunlight determined by a Croll–Milankovich cycle). Among nine errors found by a British court, Al Gore’s movie An Inconvenient Truth erroneously assumed that carbon dioxide levels and temperature rose and fell simultaneously—there was an “exact fit”. This was referred to as “Error 3” in the proceedings, which were initiated by a school governor (a lorry driver) against the educational authorities.

The Al Gore movie implied that carbon dioxide levels were somehow driving temperature. At about the time the movie was made, clear evidence emerged that carbon dioxide levels rise and fall several hundreds of years after a rise or fall in temperature. Carbon dioxide changes lag behind temperature changes. Historically, carbon dioxide has not been the significant driver of temperature that was once assumed. The erroneous assumption of an “exact fit” between carbon dioxide and temperature has contributed greatly to the present popular misunderstandings surrounding AGW.

There are various explanations for this lag. Warming water has a reduced ability to retain carbon dioxide and as the oceans slowly warm or cool they may release (or absorb) carbon dioxide. Temperature-induced changes in biological activity, rainfall or the weathering of rocks also play a role.

It is surprising that the ocean depths respond at all to changes in radiative forcing. Compared with metals, water is a poor conductor of heat. Intuitively you might expect the warmer, lighter water to sit at the surface and not mix with the colder depths. But there is a slow mixing, as exemplified by the Atlantic’s Gulf Stream. When the Atlantic’s surface is heated at the tropics by sunlight, some water evaporates. The remainder becomes saltier and heads north to colder latitudes, where it chills. This saltier water, as it chills, becomes heavier than the cold water which it overlays. It sinks and mixes with deep currents that head back to the tropics where they upwell again. An enormous conveyor belt is created, warming North Atlantic coastal regions.

The different cycles of these ill-assorted dancing partners, the atmosphere and ocean, contribute to the chaotic behaviour of climate. Several oceanic oscillations have been identified that influence climate. The peak for recent warming, 1998, was the outcome of an exceptional El Niño event in the Pacific. A big El Niño event in 2010 has also caused a recent jump in global average temperatures, which may now be about to subside. The oceans are not well understood. Methods for systematically measuring ocean temperatures, starting in the nineteenth century, have varied and only become reliable in the last five years (with a small, very recent, decline during this time observed in ocean temperatures). The ocean is where any excess heat must theoretically end up, since dry land eventually gives up any received heat while the oceans absorb it; however, recent evidence shows that this is just not happening.

Another puzzle for climate modellers is that global average temperatures have not kept up with the steady rise in atmospheric carbon dioxide. General circulation models relied on by the IPCC predicted these temperatures would rise in the current decade, but this has not happened. Accurate measurements of atmospheric carbon dioxide began as recently as 1958. The significant recent rise in atmospheric carbon dioxide began in about 1950. But there was no increase in global average temperatures until about 1976. In fact from 1940 to 1975, a period sometimes called “the Little Cooling”, temperatures appear to have been slightly lower than in the 1930s of dust-bowl fame.

Pro-AGW climate scientists claim the Little Cooling was caused by aerosols, such as sulphur dioxide, produced by the rapid expansion of industry and motorised transport that began in about 1950. According to these scientists, by 1976 there was a reduction in these aerosols because of clean air legislation in Western countries, allowing the warming from extra carbon dioxide to take effect. There are two problems with this explanation. The largely oceanic southern hemisphere, where there are few of these anthropogenic northern hemisphere aerosols, was also subject to the Little Cooling. Also, as aerosols from North Atlantic countries decreased, this may have been matched by an increase in aerosols from the rapid industrialisation of China and India in the late twentieth century.

The 1980s were warmer than the 1970s, the 1990s were warmer than the 1980s, and the 2000s have been warmer than the 1990s. However, the rise in temperatures starting in 1976 stopped in about 2000. Since then temperatures have flattened out and may have reduced. Although the decade to 2009 has on average been warmer than the average of the previous decade, it has not become warmer than the final years of the last decade, as strong-AGW models predicted. Atmospheric carbon dioxide has been steadily rising from 1950 to the present, but there has been a significant increase in temperature for only twenty-five of those sixty years.

This increase has been about 0.4 degrees and is broadly equal to the increase from 1860 to 1940, when changes in atmospheric carbon dioxide could not have been an influence. All of this suggests there is not a clear correlation between the rise in atmospheric carbon dioxide over the last sixty years and the recent increase in temperatures. The increase that has occurred, which is only fractions of a degree, is explicable as a natural fluctuation, part of the chaotic dance movements of the climate, although it is likely that there is a small AGW contribution, which is extremely difficult to identify.

The modest increase in temperatures does not fit well with bold predictions of increases of several degrees over the remainder of this century. There is a further problem with these predictions. This is that the greenhouse effect of carbon dioxide increases is logarithmic. It is not linear. Richard Lindzen, a climate scientist who is a professor of meteorology at MIT, has explained:

In terms of climate forcing, greenhouse gases added to the atmosphere through man’s activities since the late nineteenth century have already produced three-quarters of the radiative forcing that we expect from a doubling of CO2 ... the impact of CO2 is nonlinear in the sense that each added unit contributes less than its predecessor. For example, if doubling CO2 from its value in the late nineteenth century—from about 290 parts per million by volume (ppmv) to 580 ppmv—causes a 2 per cent increase in radiative forcing, then to obtain another 2 percent increase in radiative forcing we must increase CO2 by an additional 580 ppmv rather than by another 290 ppmv. At present, the concentration of CO2 is about 380 ppmv. The easiest way to understand this is to consider adding thin layers of paint to a pane of glass. The first layer cuts out much of the light, the next layer cuts out more, but subsequent layers do less and less because the painted pane is already essentially opaque.

Lindzen’s “already produced” radiative forcing should not be confused with the effect of this forcing on global average temperatures, which may take decades or centuries to respond, because of the thermal inertia of the oceans. His conclusion is that if we believe the climate models, “we have long since passed the point where mitigation is a viable strategy”. His estimate of the future outcome is: “Attempts to assess climate sensitivity by direct observation of cloud processes, and other means, point to a conclusion that doubling of CO2 would lead to about 0.5 degrees warming or less.”

The critical issue in the global warming debate is climate sensitivity. There is general agreement that acting by itself there would be a weak AGW of about 1 degree from a doubling of atmospheric carbon dioxide above pre-industrial levels. If there are positive feedbacks which amplify that effect above 1 degree, the climate is more sensitive, and if there are negative feedbacks that would reduce that warming below 1 degree, the climate is less sensitive.

One way of estimating sensitivity is to examine past events, where there is a known change in radiative forcing and it is simple to calculate the extra (or fewer) watts per square metre that result from the change and observe the effect on average temperatures to obtain a value for sensitivity. When the Last Glacial Maximum finally ended about 11,400 years ago, there was a large increase in average temperatures relative to the increase in solar radiation reaching the Earth at that time (from a Croll–Milankovich cycle). Supporters of the strong AGW case point to this event as evidence for positive feedbacks and a high value for climate sensitivity.

Deducing climate sensitivity to radiative forcing from extra sunlight when the Last Glacial Maximum ended and using that number to determine the climate sensitivity to radiative forcing from extra carbon dioxide at the present time, when average temperatures are several degrees warmer, is not straightforward. As well as the initial radiative forcing from extra sunlight at the end of the Last Glacial Maximum, there would be the following forcings induced by the change in solar radiation received by Earth: (1) reduced albedo (reflection of sunlight into space) as ice and snow retreat and dark vegetation advances and rocks and earth are exposed; (2) additional trace greenhouse gases from various sources, in particular methane (a much more potent greenhouse gas than carbon dioxide) released from melting permafrost; and (3) the greenhouse effect of additional water vapour as ice and snow melt. The value of these induced forcings can only be inferred with a high degree of uncertainty.

A further reason for scepticism is the temperature trend for central Greenland over the last 100,000 years. An ice core shows that during the last 10,000 years average temperatures in central Greenland have varied by no more than about 2 or 3 degrees. But over the previous 90,000 years (the period of the last ice age) there were sixteen sudden fluctuations of about 10 degrees or more (some of almost 20 degrees) with many smaller fluctuations of about 5 degrees. These violent and frequent jumps compared with the current relative stability in central Greenland indicate that climate sensitivity during the 90,000 years of the last glacial may have been much higher than now. There may have been positive feedbacks then that no longer operate when temperatures are warmer.

Climate sensitivity has also been estimated from short-term cooling following recent volcanic eruptions and the global temperature trend in the twentieth century. Some high and low numbers for climate sensitivity have been estimated from recent volcanic eruptions. So this is a contested area. The global temperature trend over the twentieth century may also not provide a convincing basis for determining sensitivity. There are peaks and troughs in the modest warming of about 0.8 degrees occurring since the late nineteenth century, which could have been affected by a variety of poorly understood influences, such as clouds and oceanic oscillations. Add to this the uncertainty about the exact extent of current warming. Land surface temperature measurements tend to be concentrated near cities, which are heat islands. Despite corrections for this effect, there is evidence of “contamination patterns” in regard to land surface records, relied upon by climate scientists, “related to urbanisation and other socioeconomic influences” causing “an overall warm bias over land”. Our current level of understanding is such that studies relying on past events to produce a high (or low) value for climate sensitivity are dartboard science.

There is also a crucial piece of evidence, publicised by David Evans, suggesting it is unlikely that climate sensitivity is a large number. Evans, an electrical engineer and mathematician, worked for the Australian Greenhouse Office (now the Department of Climate Change) from 1999 to 2005, modelling Australia’s carbon. He became sceptical when, in his view, “the evidence supporting the idea that CO2 emissions were the main cause of global warming reversed itself from 1998 to 2006”. The crucial evidence Evans found is in a 2006 report, Temperature Trends in the Lower Atmosphere by the US government’s Climate Change Science Program (CCSP). Climate modellers had predicted a “hotspot” in the atmosphere, at a height of about twelve kilometres in the tropics, which would prove that climate sensitivity was a high number. This “hotspot” should have emerged over the period of global warming which occurred from the late 1970s until the end of the twentieth century. But many thousands of radiosonde measurements from 1979 to 1999 found it did not.

Why is this evidence crucial? It is well known that air temperature decreases with altitude, except for rare temperature inversions, until the stratosphere is reached. This reduction in temperature, caused by the reduction in air pressure with increasing altitude, is known as the “lapse rate”. The lapse rate reduces with increases in humidity. The lapse rate would be about 10 degrees per kilometre of altitude if air was perfectly dry and rising quickly. But if air is very humid, it can be as low as 4 degrees per kilometre.

When global average temperatures were increasing over the period from 1979 to the end of the twentieth century, the extra water vapour generated by these higher temperatures could increase the depth of humid atmosphere. The CCSP’s 2006 report predicted: “the lapse rate can be expected to decrease with warming such that temperature changes aloft exceed those at the surface”. However, the radiosonde measurements confounded this prediction. The report found: “observational data sets show more warming at the surface than in the troposphere [the atmosphere up to about twelve kilometres], while most model runs have larger warming aloft than at the surface.”

If warming at the surface exceeded warming in the upper troposphere, this probably means the extra humidity was condensing into low-level clouds, which reflected incoming sunlight (with a negative effect on temperature), rather than increasing the depth of humid air that would have a greenhouse effect. Although the CCSP is silent on the matter, the inference is that climate sensitivity is a low number and feedbacks from changes in radiative forcing are negative rather than positive.

The IPCC’s First Assessment Report in 1990 and Second Assessment Report in 1995 included graphs showing that temperatures were warmer in the Medieval Warm Period from about 1000 to 1300 than they were towards the end of the twentieth century and that there was a Little Ice Age. This was the widely accepted view at that time and confirmed by numerous studies. (It has since been confirmed by Loehle and McCulloch’s 2000-year temperature reconstruction, published in 2008, based on eighteen series of non-tree-ring proxies, which found that the warmest tridecade of the Medieval Warm Period “was warmer than the most recent tridecade, but not significantly so”.)

Then in its Third Assessment Report of 2001, the IPCC dropped graphs which showed a warmer period in medieval times and instead included the now notorious “hockey stick” graph. This new graph purported to show northern hemisphere temperatures from 1000 to the end of the twentieth century, with the Medieval Warm Period and the Little Ice Age as minor fluctuations in a relatively flat line, and a sharp rise only at the end of the twentieth century, resembling the blade of a hockey stick. It supposedly represented a warming in the last two decades of the twentieth century which was unprecedented over the previous 1000 years.

The hockey stick came from a 1999 study by Michael Mann and co-authors based mainly on studies of growth rings of trees, and also ice cores and coral, which provided proxy evidence of climate over the last 1000 years and built on an earlier study the co-authors published in the influential science journal Nature. In promoting this rewriting of climate history, the IPCC ignored numerous earlier studies and anecdotal historical evidence of the Medieval Warm Period and Little Ice Age.

The wider climate science community accepted this convenient reversal of a historical paradigm. It required two amateurs to demolish the hockey stick. Stephen McIntyre, living in Toronto, had been a statistician working at the speculative end of the mining industry. He had memories of Vikings in Greenland from his schooldays and became casually interested in the IPCC’s hockey stick.

In April 2003 he was surprised to read an article by an IPCC author, Keith Briffa from the University of East Anglia, finding a decline in growth-ring widths for a large sample of trees in the twentieth century. A decline in growth-ring widths would indicate a decline in temperature. This seemed at variance with the use of tree-ring widths in the IPCC’s hockey stick to show a temperature increase in the twentieth century. McIntyre assumed there was an explanation for this. Out of curiosity he wrote to Mann, the main author of the hockey stick. According to McIntyre:

To my astonishment, Mann said that he had forgotten where the data were. It seemed that nobody had verified the study in the way that I was used to things being verified [in the mining industry where geologists must make available all data on which their reports are based]. I thought—well, if nobody else has done this, I will.

McIntyre was not an academic. He teamed up with Ross McKitrick, a professor of economics at the University of Guelph, and together they published an analysis of Mann’s hockey stick. They found the data did not produce the results claimed by Mann and his co-authors “due to collation errors, unjustifiable truncation or extrapolation of source data, obsolete data, geographical location errors, incorrect calculation of principal components and other quality control defects”.

The findings of McIntyre and McKitrick caused a furore. A committee headed by Edward J. Wegman, a professor of statistics and chair of the US National Research Council’s Committee on Applied and Theoretical Statistics, lodged a ninety-two-page report (including appendices) with the US Congress in 2006. The Wegman report found McIntyre and McKitrick’s criticisms of the hockey stick were “valid and their arguments to be compelling”. The report identified a “decentering error” in Mann’s hockey stick findings, caused by selecting the period 1902 to 1995, when temperatures were rising, to calibrate the proxy data set. This was unrepresentative and dissimilar to the millennium temperature profile and “its net effect ... is to preferentially choose the so-called hockey stick shapes”. The report suggested Mann and his co-authors may not have been aware of their error and found: “Even though their work has a very significant statistical component ... there is no evidence that Dr Mann or any of the other authors in paleoclimatology studies have significant interactions with mainstream statisticians.”

McIntyre and McKitrick found that the hockey stick shape disappeared, using Mann’s data, if a particular bristlecone pine chronology was omitted. This chronology was contained in Graybill and Idso’s 1993 study, “Detecting the Aerial Fertilization Effect of Atmospheric CO2 Enrichment in Tree Ring Chronologies”. The purpose of the study was to test if increases in atmospheric carbon dioxide had a fertilising effect on bristlecone pines, and they did. The tree rings were wider. Arguably a study designed to determine the fertilising effect of carbon dioxide should not have been included in a later survey using tree rings as temperature proxies. Higher carbon dioxide levels rather than warmer temperatures may have been the main influence on the increased rate of growth. Tree rings are problematical temperature proxies because they may be a proxy for rainfall and a variety of influences as well as temperature.

The outcome was that a historical paradigm—the existence of a distinct Medieval Warm Period and Little Ice Age—was jettisoned on the basis of ambiguous data from some bristlecone pines. This paradigm had been established by more than a hundred studies of which more than twenty related to the southern hemisphere, although it should be emphasised that the southern hemisphere data are not conclusive regarding a Medieval Warm Period.

The hockey stick was a cause célèbre among a group of interested observers, and its defects were publicised on a website, Climate Audit, which McIntyre now set up. But the deficiencies of the IPCC process did not become known to a wide public until the Climategate e-mails, more than a thousand of them, were leaked or hacked from the website of the University of East Anglia in November 2009. The most notorious of these was an e-mail from Professor Philip Jones to Mann and his co-authors dated November 16, 1999, which stated: “I’ve just completed Mike’s Nature trick [referring to the journal where the hockey stick first appeared] of adding in the real temps to each series for the last 20 years (ie from 1981 onwards) and from 1961 for Keith’s to hide the decline ... Cheers Phil.”

We have already alluded to Keith Briffa’s tree rings anomalously indicating a decline in temperature in the late twentieth century. This e-mail is referring to a graph in the IPCC’s Third Assessment Report showing several coloured lines that converge in the late twentieth century, at which point a green line representing Briffa’s study is amputated, because including it in full would have shown a decline in temperature, implying a credibility problem with the IPCC’s methodology. McIntyre has written regarding this e-mail:

As a reviewer of the [IPCC’s] Fourth Assessment Report I asked that the deleted data be shown and explained as best they could. They refused. Jones’s version of the trick was even more simplistic [than Mann’s]—he simply spliced temperature data onto tree ring data, removing the real data—a technique that Mann later denied had ever been used.

The hockey stick has spawned a number of new hockey sticks. As recently as November 2009 a “news scan” with the reassuring headline “Still Hotter than Ever” in the Scientific American (a sister publication of Nature) affirmed: “A new analysis creates a better ‘hockey stick’ of rising temperatures.” These attempts to resuscitate the hockey stick have been criticised on McIntyre’s Climate Audit website, mainly on the basis that the new hockey sticks essentially recycle the same questionable data—a view which is confirmed in a Climategate e-mail of Briffa’s. McIntyre has continued to find errors in new studies, such as the cherry-picking of data. The relish and banality of the headline “Still Hotter than Ever” and the phrase “better ‘hockey stick’” are symptomatic. They are the language of a climate change industry intent on self-preservation and selling a product.

The original hockey stick should have been buried and forgotten after the Wegman report. What is of greater concern is that a wider community of climate scientists has stood by the authors after errors were exposed, and continues to do so. If the groupthink of climate scientists requires them to defend the pseudoscience of the hockey stick, can their other findings be trusted?


The final part of this article, on the economics and politics aspects, will appear in the April issue. Subscribe now...


Geoffrey Lehmann is a poet. He was formerly a partner of a major international accounting firm and Chairman of the Australian Tax Research Foundation.

Peter Farrell is Founder and Executive Chairman of Resmed Inc, foundation Director and former Professor of the Graduate School of Biomedical Engineering at the University of New South Wales, Chair of the Executive Council, Division of Sleep Medicine, Harvard Medical School and Member Visiting Committee, Whitaker College of Life Sciences MIT.

Dick Warburton is Chairman of Westfield Retail Trust, Magellan Flagship Fund Ltd and the Board of Taxation and a Director of Citigroup Pty Ltd and of the Smith Family of which he is also Chairman-elect. He is a former Chairman and CEO of Du Pont Australia and New Zealand.

Wednesday, February 16, 2011

Fear Of Death

From American Thinker

(Liberalism in Australia is synonymous with left politics)

Liberalism and the Fear of Death

By Robin of Berkeley

Like most of you, I have several websites that I read on a daily basis. One of them is Lucianne.com, which is fondly known as Ldot. Last Sunday, I was shocked and deeply saddened to discover that Lucianne Goldberg's oldest son, Joshua, died of a fall at the age of 43. What a tragedy, and the unexpectedness of his passing adds a level of trauma to grief. My heart goes out to Lucianne and her family.

On a personal level, I'm also coping with the horrific news of one of my oldest friends being stricken with a catastrophic disease. So my mind has turned lately to heavy, sobering topics of life and death.

We can't live our lives perpetually thinking of potential losses; this would make our time on earth feel unbearable. However, there are reminders of mortality that startle, such as visiting a website and finding that families, both the Goldbergs and the L Dot family, are grieving. And then there are the personal tragedies that we must face in this all-too-human existence.

A while back, a reader wrote and asked me a question, and my response shocked him. He asked, "On the deepest level, what draws people to progressivism?" I answered this way, "There are so many reasons, but if you're asking me the very deepest one, I think it's the fear of death."

A bit unnerved by my response, the reader said he'd need to think about it. A few months later, though, he wrote back and said he was finding much truth in my unsettling words.

Ernest Becker devoted an entire book to the subject, a Pulitzer Prize winning tome called, The Denial of Death. Becker wrote that while we all know we will die some day, most people live their daily lives in a state of denial. Becker concluded that fear of death shapes every aspect of a person's life.

One might think that my field of psychotherapy is a rare exception, that psychotherapists can speak easily about death. Not true, though most therapists are adept at helping others with their loss and grief. We therapists, like most people, rarely broach the topic of our eventual demise.

I had a fascinating conversation once with a mortuary director, whom I contacted a few years ago after my parents died. Their passing, three weeks apart, blew the curtain off of my own personal denial. I decided I wanted to make my own funeral arrangements in advance in order to spare my loved ones -- and also to exert some control over the inevitable.

I mentioned to the funeral director that my friends were all aghast at the prospect of pre-planning their own burial. She responded that morticians were no different. Few, including herself, had internment plans, preferring not to think about it. What an astonishing example of denial, given that a funeral director is in the business of death and dying!

I mentioned earlier my email exchange with a reader, and how I explained progressivism as denial of death. Let me say more. While most people experience some level of denial, we all know that we will someday die. People may be drawn to the left to create meaning in their lives while they are still alive.

They have no other way to organize this overwhelming existence, to create order out of apparent chaos. By espousing leftist ideals and worshiping false idols, many progressives have discovered their own unique way to conquer death. Even if leftists profess to be staunch atheists, doubt may lurk; therefore, their activism offers the prospect of redemption.

Many of these progressives would never engage in vicious actions against conservatives, since this would be bad for their karma; I was one of those types, as are all my friends. (Of course, there are also the nihilistic progressives, another breed entirely. Believing that life is inherently meaningless, nihilists may act out, and then take no responsibility for their cruelty.)

It's true that people flock to the left because of misinformation from the MSM. And many progressives follow along, sheep-like, because of brainwashing by schools and the media.

But I think that the attraction to radicalism may go much deeper; being an activist offers a balm for some fearsome existential issues. For many, progressivism meets a basic, human longing to matter, to make a difference in this world before it all passes away.

While conservatives and progressives disagree about pretty much everything, there is one common denominator: everyone who is alive this very moment will one day no longer walk this earth.

Human beings -- Left, Right, and in the Middle -- all understand this truth, at least on some level. The knowledge of our finiteness lurks right under the surface, until, one day, tragedy shatters our illusions.

But the difference is that most conservatives have a well-worn path to liberation, with an ancient blueprint and a Savior to guide them. No so with those leftists who have rejected ultimate truth.

It's no wonder then that they embrace the Gospel of Liberalism. What other means do they have to still the voice of disquietude and to shine a faint light onto the darkness?

A frequent American Thinker contributor, Robin is a recovering liberal and a psychotherapist in Berkeley. Robin's articles are intended to entertain and inform, not to offer psychotherapeutic advice or diagnoses.

Sunday, February 06, 2011

Climate Change

Article from the The Australian 7thFeb2010

History of science shows consensus can be mistaken

FEW things have more bedevilled the debate about global warming than the question of scientific consensus. About what the scientific consensus on the subject is, and about what degree of deference should be paid to scientific consensus as such. Both debates have been seriously aggravated by two other factors. Global warming seems to have colossal economic implications, which has activated the concerns of many interested parties; and the ecological nature of global warming has stirred up heated ideological passions that go well beyond the science. It's all very well to feel either passionate or sceptical about these matters, but how are we to think clearly about them?

David Weintraub's How Old is the Universe offers five useful clues. The author has nothing to say about climate science and all parties to the climate debate can, therefore, chill out and think dispassionately here.

His general argument is about how we can know the age of the universe. He asks: "How have 400 years of science brought us to this point at which astronomers, cosmologists and physicists can claim that the universe came into existence at a specific moment 13.7 billion years ago? And how much confidence should you have in this statement?"

These are similar to the big questions that need to be asked (and answered) regarding the anthropogenic global warming hypothesis. Just one of his chapters provides the five useful clues to which I referred.

That chapter is about the discovery that the Milky Way is not the whole universe, but actually a very tiny part of it. The early breakthroughs in modern cosmology had been the shift from a geocentric to a heliocentric view of the solar system and then to a realisation, as telescopes became more sophisticated and the understanding of the light spectrum more refined, that there were vastly more stars than anyone had imagined and that they were much farther away than anyone previously guessed.

Among them there were strange phenomena called spiral nebulae, wispy cloud-like formations that called for an explanation. In 1755, the philosopher Immanuel Kant, in his Universal Natural History and Theory of the Heavens, speculated that spiral nebulae might be what he called "island universes" outside the Milky Way. A debate about this went on for many decades, but there was no scientific consensus one way or the other.

However, in the first decades of the 20th century, a strong scientific consensus developed that the Milky Way was, in fact, the entire universe. A range of detailed studies in the 1910s by leading astronomers Vesto Slipher, Harlow Shapley and Adrian van Maanen seemed to confirm this. Shapley's work was especially brilliant. He upended the consensus that had reigned since Copernicus that the sun was the centre of the universe, showing that we should see the centre as being 40,000 light years away in the heart of the Milky Way. The debate now appeared to be over: Kant had been wrong. But it turns out he wasn't.

In Weintraub's words: "The steady accumulation of evidence from a decade of work by Slipher, Shapley and van Maanen appeared to have driven the astronomical community toward broad consensus. Spiral nebulae are part of the Milky Way. They are not island universes. The Milky Way encompasses the entire universe." A few years later, new observations proved this consensus completely wrong.

In 1923-24, brilliant young astronomer Edwin Hubble, having collected a great deal of data using the newly commissioned 100-inch telescope at Mount Wilson Observatory, wrote to Shapley to say that it looked as though Andromeda and M33 were well outside the Milky Way. "The straws are all pointing in one direction," he commented, "and it will do no harm to consider the various possibilities involved." Shapley responded with disarming humility, "I do not know whether I am sorry or glad - perhaps both." Quite suddenly, it had been shown that the universe was vastly larger than scientific consensus had allowed.

Weintraub asks, "How had the astronomy community, including Slipher, van Maanen and Shapley, been led so far astray?" Slipher, he points out, had made some good measurements but had misinterpreted them and also made statements that were "rash and not supported by sufficient evidence". Van Maanen's measurements had been simply incorrect. "Eager to discover what he believed must be true, he misled himself, finding the answers he thought should be in his data rather than the answers truly revealed by his photographs." Shapley had actually made "excellent measurements, but he did not make enough of them". Incredibly, he concludes, despite all these errors in trying to bring closure to the island universe debate, the research of Slipher and Shapley was to actually help provide the basis for the next momentous step in Hubble's research: the discovery that the universe was not only enormously larger than the Milky Way, but was expanding.

How does all this help in regard to the climate science debate? First, it shows that we are justified in being wary of foreclosing major debates based on scientific consensus, since it can be in error. Second, it shows that the way to challenge and correct scientific consensus is not through polemic or denial, but through specifying crucial variables and deductions and testing them scrupulously, in the manner of Hubble. Third, it shows that there is, nonetheless, such a thing as scientific consensus and that when handled in the manner just described, it tends to prove self-correcting. Fourth, it shows that ideally such correction will occur, as it did between Hubble and Shapley, on the basis of lucid examination of "the various possibilities". Finally, it shows that overwhelmingly human beings have always lived oblivious to the truth about the natural world and that only exacting and brilliant science has been able to discover what that truth is. In the climate science debate, we would all benefit from taking note of these five lessons as we seek to develop a rational consensus on the subject.

Paul Monk is co-founder of Austhink Consulting, the author of The West in a Nutshell: Foundations, Fragilities, Futures (2009), and a regular media commentator on public and international affairs.

Saturday, November 13, 2010

Early Learning

Infants can be groomed for learning


VERY early intervention could be crucial in eradicating educational disadvantage.

BRITAIN'S Deputy Prime Minister Nick Clegg has come up with an initiative that might just break the self-perpetuating cycle of educational disadvantage.

A few weeks ago he announced that the government would be setting aside pound stg. 7 billion ($11.3bn) during the course of the current parliament for a program called the pupil premium.

Most of it will be spent on free nursery-level education for Britain's poorest children.

The aim is to narrow in the early years the vocabulary gap between the disadvantaged young and everyone else. As Clegg put it: "Children from poor homes hear 616 words spoken an hour on average, compared to 2153 words an hour in richer homes. By the age of three, that amounts to a cumulative gap of 30 million words."

The breadth of vocabulary that middle-class infants are exposed to has long been recognised as a significant factor in preparing them for success at school.

It's not just the sheer number of words or being familiar with an abundance of synonyms. A lot of our history, cultural assumptions and sense of humour are embedded in the mother tongue and can be almost effortlessly assimilated.

A broad vocabulary emboldens young minds to extrapolate from the known to new, unfamiliar words and get a sense of what they mean. As well, it introduces the mind to niceties of distinction: for example, the difference between being "pleased", "not displeased" and "not best pleased" (which, for the benefit of younger readers, is a way of saying "not pleased at all").

There is a growing consensus that the most effective way to improve educational outcomes is by concentrating money and attention on the nursery. Recent research into child development at the University of London by Leon Feinstein found that the size of a child's vocabulary at 22 months is a reliable indicator of subsequent performance at school.

Middle-class kids probably aren't any brighter on average than their poorer age-mates, but their infant minds have usually been more assiduously stimulated when it matters most, early on.

The Spectator's Toby Young is a doting father who, as a columnist, takes a great interest in educational reform. In a recent piece, "Baby talk can close the attainment gap", he reflects in the light of his experience on a campaign just launched in Britain by the National Literacy Trust called Talk to Your Baby.

"You'd be forgiven for thinking it was dreamt up by a Notting Hill yummy mummy . . . It sounds absolutely barmy, the parenting equivalent of talking to plants, but in fact there's plenty of evidence to suggest that talking to children under three has an almost magical effect on their cognitive development and transforms them into more intelligent adults."

Young cites a study by a group of Harvard economists who found that children who've had a good nursery education earn, on average, $20 a week more than their peers by the time they're 27. Apparently that holds true even allowing for all the other usual factors, including social and economic status and the quality of their subsequent schooling.

Coming at the question from the other end, he cites a book by two educationalists at the University of Durham. One of their main findings is that the attainment of middle-class children doesn't vary much according to what school they attend. Generally they tend to do well even in poorly performing schools. In a nutshell, a language-rich preschool environment and a domestic setting to match it can inoculate kids against the damage that substandard schools do to their classmates.

Young offers some rather endearing anecdotal evidence. "When my daughter Sasha was around six months old I read her Pride and Prejudice. Sounds pretentious and it is, but that's one of the advantages middle-class children enjoy over working-class children: their parents are willing to risk appearing pretentious if they believe their behaviour will secure their offspring a competitive advantage. And it worked.

"I have a video of Sasha scoring 100 out of 100 in a flash card test before her first birthday. By contrast, I read all three of her brothers Peepo! and none of them started talking until they were two."

Although reading Jane Austen to babes in arms might be taking things a bit far, the first books my generation's parents read us were often quite demanding and designed to captivate the reader as much as the child. I'm thinking of Alice in Wonderland, Gulliver's Travels, The Magic Pudding, the nonsense verse of Ogden Nash and Oscar Wilde's volume of fairy stories. Each of those books has hidden depths and unsettling interludes where things are not as they seem. Each might serve as an introduction to irony.

Young's other point about the role of parental pushiness in securing a competitive advantage for their children is an important one. I noticed it early on, growing up on the raffish outskirts of Bellevue Hill in Sydney.

A lot of the neighbouring blocks of flats were occupied by Jewish immigrants from central Europe and I played and went to primary school with their children. There was scarcely a boy among them who had not settled on a choice of profession, with a modicum of parental nudging, by the time he was six.

Although my parents were people of cultured tastes and ambitious for their only child, my mother's teenage career on John Dease's The Quiz Kids program had given her an aversion to precocious infants and she flatly refused to teach me to read before I went to school. Long before I was literate, most of my playmates could read a little English, speak Yiddish and perhaps another European language, and were beginning Hebrew lessons.

As well, willy-nilly, most learned a musical instrument. While some of them complained of a pressure-cooker existence - and left me feeling like a cheerful underachiever - they had a head start in life that most parents now can only dream about.

My last four columns and this week's have all concentrated on what constitutes a great education and why so few of the rising generation have access to one. I fear it has been rather bleak reading for the most part, which is why I'm ending on a positive note.

Very early intervention to break the cycle of educational disadvantage holds out far more hope - especially for Aboriginal infants and the children of what used to be called the lumpenproletariat - than the public system ever has. It ought to be high on the productivity agendas of both the main parties.

Saturday, October 16, 2010

FoodForThought

American Thinker Article

Sociologists: Liberal Policy Didn't Cause the Mortgage Crisis, Racism Did

By Monte Kuligowski

"Predatory lending aimed at racially segregated minority neighborhoods led to mass foreclosures that fueled the U.S. housing crisis, according to a new study published in the American Sociological Review." That's how the Reuters
story of October 4, "Racial predatory loans fueled U.S. housing crisis: study," opens.

The "new study" is an academic article titled "Racial Segregation and the American Foreclosure Crisis," which was written by a graduate student at Princeton and his professor.

Inasmuch as the "new study" further diverts attention from the real reasons for the foreclosure crisis and advances racism as a cause, the piece is becoming a smashing success within the "mainstream" media. Not only was the banking industry greedy, but new evidence shows that its "predatory lending" policies were in fact racist as well.

During the primaries and race leading to the 2008 presidential election, gas prices happened to skyrocket, and shortly thereafter, the giant housing bubble burst. It was like the breaking of a piñata, scattering candies everywhere for Candidate Obama. With a little help from the news media, the bubble's burst couldn't have happened at a better time.

Acting with lightning speed, the Democrats and their media created the non sequitur narrative. It was Bush's fault! The free markets failed because the reckless cowboy refused to regulate the banking and financial industries.

Never mind that those were already highly regulated industries -- and no one has yet revealed the regulations that Bush opposed that would have prevented the bursting of the artificial bubble.

Also pay no attention to the fact that the Democrats had controlled Congress since 2006 and had resisted repeated requests for tighter accounting of Freddie Mac and Fannie Mae. The likes of Barney Frank assured us that everything was hunky-dory with the government-backed lending system.

And, lastly, if we are to accept the narrative, we must forget about Jimmy Carter's Community Reinvestment Act, the instrument from which the government created the artificial bubble. The Act is little more than liberal feel-good social engineering that levels the playing field for low-income minorities. According to liberal thought (see the words of former HUD Secretary Andrew Cuomo), institutional racial discrimination was the reason banks were not approving enough loans for minorities.

The federal government, therefore, had to intervene. The Clinton administration revived and enforced the Act in the1990s with vengeance; and with a little help from groups like ACORN, minority loan approvals reached all-time highs.

Application of the Act was done in the name of the right to "affordable housing." Affordable housing really meant that everyone has a right to get a mortgage on a home. At the threat of ACORN members getting crazy in bank lobbies and with the coercion of federal law, traditional qualifications for getting loan approvals (verifiable income levels, sufficient down payments, standard credit histories, etc.) were thrown out the window.

What the federal government forced upon the mortgage industry was like the screeching of fingernails on a chalkboard to the principles of the free market system. No businessman in his right mind would approve loans, in the name of social justice, for those who couldn't afford them. So ridiculous was the practice that the government had to create an entire system to back the devalued mortgages generated by liberal economic-justice policy.

Prior to the bubble's burst, the bankers were the good guys so long as they were lending to people who really couldn't afford homes. The government's manipulation of the markets led to trading in worthless paper and derivative hedging by greedy Wall Street investors. But in the heyday of easy loans, easy money, and rampant corruption at Freddie and Fannie, the Democrats were happy and content.

So long as home prices were going up and equity was accruing, the artificial markets seemed almost real. The subprime loans seemed to work. It went on for many years. But after gas prices began hovering at $4.00 per gallon, waves of mortgage defaults crashed throughout the country. Once the system collapsed, a new set of facts was needed -- and reality was quickly turned upside-down.

Even though the mortgage industry was forced to make "risky loans" to meet government quotas, the bankers became the bad guys. Risky loans were blamed on the free market system. Capitalism had failed.

The mortgage people were suddenly guilty of selling "predatory loans" to innocent minorities. Liberal Democrats had authored, implemented, and maintained the irresponsible lending policies which led to the financial crisis. But after the burst, we saw the most culpable Democrats -- Obama, Dodd, Frank, et al. -- blaming the Republicans and capitalism.

The best fiction novelist in the world couldn't make this stuff up. How the establishment left was able to turn the entire situation on its head is beyond belief (in the aftermath, we even witnessed a surreal Dodd-Frank reform bill). And now we have a "new study" to show that the practice of "predatory loans" was likely based on racial discrimination!

In the piece (the new study), the authors first note that the Fair Housing Act of 1968 didn't work out so well and that minorities continue to "live under conditions of hyper segregation" in the big inner cities. Declines in the black population in communities in "New York, Chicago, Detroit, Atlanta, Houston, and Washington," have been "minimal or nonexistent."

I guess we're supposed to attribute the "segregation" problem to racial discrimination and not the government welfare policies that have crippled an entire segment of the black population.

From there, the authors tell us that "a careful reading of recent scholarship on segregation and mortgage lending shows that racial discrimination occurred at each step in the complex chain of events leading from loan origination to foreclosure."

You see, "high levels of segregation create a natural market for subprime lending and cause riskier mortgages, and thus foreclosures, to accumulate disproportionately in racially segregated cities' minority neighborhoods."

Hmm. Why do you suppose "segregation" creates "a natural market for subprime lending?" A subprime mortgage happens to be a type of loan for people with poor credit histories. Think there's any connection between poor credit ratings and government dependency? Perish the thought.

Prior to the politicizing of the mortgage industry, people with poor credit histories were turned down for home loans. "Pay your bills, stay at your job, save your money, and come back and see me in a few years," was the advice of the banker before ACORN and social justice came along. Subprime loans were an accommodation for people who shouldn't have gotten loans in the first place.

Perhaps the most disturbing part of the "new study" is the section in which the authors essentially call blacks in the inner cities stupid. We're supposed to believe that because "pawn shops, payday lenders, and check cashing services that charge high fees and usurious rates of interest," exist in "minority areas ... minority group members are accustomed to exploitation and [are] frequently unaware that better services are available elsewhere."

So the mortgage crisis was caused not by the government forcing lenders to grant loans to those who really didn't qualify, but by "predatory lenders" who targeted inner-city minorities who were just too dumb to know that better services were available elsewhere.

The level of dishonesty associated with the liberal media (and academic) narrative of the mortgage crisis is astounding and if the general public ever gets the facts the Democrat Party will be in peril for decades to come.

Monday, October 04, 2010

Euthanasia

An article in the Australian by Paul Kelly
29thSeptember2010

THE Labor leader should not let this law be put back on the books.

NEW Prime Minister Julia Gillard will be called on to reveal more of her core beliefs, with the immediate test being the euthanasia bill that highlights a cultural divide in Western society.

Greens leader Bob Brown's decision to introduce a private member's bill to restore the power of parliaments in the Northern Territory and the ACT to legislate for euthanasia poses a political challenge for the minority Labor government and for Gillard.

Brown's bill in its mechanics deals with territory powers but its essence is to open the door to euthanasia in Australia.

The bill is facilitated under new parliamentary procedures and the Labor-Greens alliance.

Gillard has announced that Labor will allow a conscience vote but that cannot gainsay the political question: Will the Gillard government become the means to authorise legalised killing in Australia by abandoning the 1997 law of the national parliament?

Start of sidebar. Skip to end of sidebar.

End of sidebar. Return to start of sidebar.

This would be a threshold and false step for Australia. It is difficult to imagine that Gillard wants this stamp on her prime ministership.

During the past dozen years euthanasia has won little acceptance in most Western nations beyond The Netherlands and Belgium in Europe and the states of Oregon and Washington in the US. Two years ago human rights champion Frank Brennan told a Senate committee: "Since the commonwealth exercise the US Supreme Court has said there is no right to euthanasia. It would seem to me that on balance nothing has changed or, if anything, the anti-euthanasia case is probably slightly strengthened if we look at developments in equivalent jurisdictions."

The clinching case against euthanasia has been put by Australian-Canadian lawyer and ethicist Margaret Somerville in evidence to the Australian parliament: "If you look at the most fundamental norm or value on which our type of societies are based, it is that we do not kill each other. No matter how compassionate and merciful your reasons for carrying out euthanasia, it still alters that norm that we do not kill each other to one where we do not usually, but in some cases we do."

Once this threshold is crossed and killing is sanctioned, what are the terms, conditions and safeguards? Given the frailty of human history, does anybody doubt the scope and scale for abuses?

In a speech to the NSW parliament on October 16, 1996, premier Bob Carr said this question was "the bottom line that we must face as legislators": Was it possible to legislate euthanasia with the safeguards necessary to assure the sick, vulnerable, indigenous and invalid? "I do not think it is possible," Carr answered as the parliament found against euthanasia.

In 1995 the Northern Territory passed its euthanasia law, an event of moment for the Territory and Australia. The law was a shocker and the safeguards deficient. It was negated by the 1996 bill moved by Liberal MP Kevin Andrews, as a private member, carried in the House of Representatives on an 88-35 conscience vote on December 9, 1996. In the Senate the Andrews bill was passed 38-33 in March 1997.

The national parliament's overriding of the Territory was a proper exercise of its constitutional powers and political authority. There was no issue of territory rights, then or now. The national parliament had the constitutional power and, as Andrews said, if the national parliament could not legislate on an issue that went, literally, to the life and death of its citizens, then what on earth was its purpose?

The entire key to the euthanasia debate lies in its great paradox: consistent polls showing a majority in favour. But what, exactly, are people supporting? The 1996-97 debate provides the answer: most people think that turning off life-support machines and discontinuing life-preserving treatment is euthanasia. In fact, this is nothing to do with euthanasia. Indeed, it is the precise opposite of euthanasia. If a family turns off a life-support machine, the patient dies because of their illness, not because of the doctor. But if the doctor gives a lethal injection, then the patient is killed. This is a fine yet critical distinction.

Because euthanasia involves one person being sanctioned to kill another, it cannot be seen just within a human rights framework. It is an ethical and intellectual failure to pretend that euthanasia is merely a human right awaiting recognition. It is about society and its norms and values. There is no escaping the chasm that euthanasia crosses. Creation of a legal framework to permit killing must affect the way all people perceive their lives and the expectations that friends, family and doctors have of patients.

This issue was best put by former NSW politician Tony Burke, now Minister for Sustainability and Environment in the Gillard government, when he led the 1996 campaign from Labor's side: "There is a maxim often used in the capital punishment debate which applies perfectly to legalised euthanasia: whether you support it or oppose it in principle, if one innocent person is going to be killed, that is too high a price." Exactly.

Former Labor MP Lindsay Tanner, on October 28, 1996, tore to shreds the logic of the Northern Territory law. Asking where the line should be drawn, Tanner asked rhetorically: "Why is it that it is only the terminally ill? Why shouldn't it also be the severely disabled? Why not somebody with an incurable mental illness? Why not children who are terminally ill?"

Tanner's point is that lines cannot be firm or fixed. Reinforcing his argument is that many euthanasia advocates, such as Peter Singer, actively promote its extension more widely.

Tanner also dismissed the furphy about territory rights, saying it was absurd to let the Northern Territory, representing 1 per cent of the people, make such a decision affecting all Australians. Finally, he asked: What about the terminally ill who do not want to die? Good question. It was the question hammered by Burke and Andrews. Once the killing culture is established, the aged, sick and disabled will have to consider whether to put up their hands. They will feel obligated. Financial pressures, healthcare costs and expectations of family will assume new dimensions.

The old joke for the sick is that euthanasia is "putting us out of your misery".

Yes, some people in pain want to die and it is hard to deny their claim. Yet there are many others glad to be alive today who would have volunteered for euthanasia if it had been legal five years ago. As Andrews said in 1996, a well person who is suicidal is offered counselling, but under euthanasia an ill person who is suicidal becomes an option for death.

Brown's bill will enable the territories, if they wish, to pass new euthanasia laws.

Gillard gave a tentative sign last weekend of her doubts.

She will guarantee harsh judgments by branding herself as a pro-euthanasia PM or, even worse, by letting such laws back on the books.

Monday, August 09, 2010

The heritage of Western civilisation

Article from Newsweekly

by Cardinal George Pell AC

I propose to begin by speaking about China. This is not because I believe that China must achieve economic supremacy (20 years ago we were ascribing that honour to Japan), but because China is a radically different culture, nourished for 2,000 years by the teachings of Buddha and Confucius before the destructive barbarism of Mao and the Red Guards; a nation which is now searching for the secrets of Western vitality and for a code or codes to provide decency and social cohesion that is compatible with economic development.

Let me give two examples, admittedly only two straws in a vast cyclone.

In 2002 a group of tourists from the United States visited the Chinese Academy of Social Sciences in Beijing to hear a talk by a Chinese academic who prefers to remain anonymous. Speaking in the plural for unnamed fellow thinkers, he described their search for what accounted for the pre-eminence, the success of the West all over the world. Their studies ranged widely. Originally they thought the main reason was more powerful guns; then it was Western political systems, before considering the claims of the Western economic system.

Finally, and I quote "in the past twenty years, we have realised that the heart of your culture is your religion: Christianity. ... The Christian moral foundation of social and cultural life was what made possible the emergence of capitalism and then the transition to democratic politics. We don't have any doubt about this". [1]

My second straw in the gale comes from Zhao Xiao, an official Chinese economist, who wrote also in 2002 a fascinating article titled "Market economies with churches and market economies without churches". It made the obvious points that market economies promote efficiency, discourage laziness, force competition. They work and produce wealth. But, he pointed out, a market cannot discourage people from lying or causing harm and indeed may encourage people to be industrious in their efforts to harm others and pursue wealth by any means. [2]

Zhao is critical of the corruption, swindles and exploitation in Chinese economic life. His diagnosis of China provides a fascinating comparison not only with Christian idealism and indifferent performance, but with the brave new world of the Western propagandists for radical secularism where the call for common moral standards is rarely heard.

Zhao writes: "These days Chinese people do not believe in anything. They don't believe in God, they don't believe in the devil, they don't believe in providence, they don't believe in the last judgement, to say nothing about heaven. A person who believes in nothing can only believe in himself. And self-belief implies that anything is possible — what do lies, cheating, harm and swindling matter?" [3]

Often an outsider is needed to see what is painfully obvious, especially if the insight or truth is unpalatable and systematically avoided by many in the commentariat.

In the West even the atheists and secularists live on the remains of the Christian moral system, on a Christian overdraft. In China there is no such invisible hand, no powerful if unacknowledged traditions which inhibit the Darwinians among us from being social Darwinians. Even Richard Dawkins and Peter Singer claim to be philanthropists, believers in brotherly and sisterly love.

In order to recognise our strengths it is useful to examine differently constructed societies such as ancient Rome or modern China and the paths they have chosen.

China today is not a democracy, but a militarily supported dictatorship where hundreds of millions do not participate in the increasing prosperity, and where a ruthless one-child policy has been imposed for decades. When this policy was implemented in a society which prefers sons to daughters, and where modern technology now enables the sex of babies to be discovered before birth, the end result was the current sex ratio of 130 boys born for every 100 girls (the natural range is 103-06 boys for every 100 girls). By 2020 China will have 30 to 40 million more males than females 19 years or younger. [4]

On top of this, China will also follow Russia, Japan and most of Europe into a demographic implosion, with growing numbers of old people and fewer and fewer young people to support them. But China (and indeed India) will do this long before a decent standard of living extends to all or even most of their populations.

It is this social turmoil as well as the spectacular economic development which is impelling thinkers and government leaders in China to search for agents of social cohesion and impelling some of their thinkers to make these startling claims about Western superiority and the Christian contribution to this.

For me Western civilisation derives from Athens, Rome and Jerusalem a wonderful mixture of reason, law and Judaeo-Christian monotheism.

Two rudimentary qualifications or clarifications are immediately necessary.

The dark side of the Western tradition has to be acknowledged, ranging as it does from the revolutionary violence of the French Revolution through to the tyrannies of the 20th century, Nazism and Communism. Pol Pot was trained by Parisian Stalinists and even Mao owed more to Stalin than to the example of any Oriental despot.

But neither Nazism nor Communism should be listed as belonging to Western civilisation, because they both hated the Judaeo-Christian God and substituted the law of the jungle for natural law. George Steiner has even claimed that the insane Nazi hatred of the Jews derived from the unique Jewish role of introducing monotheism into world history; or, in secularist terms, from their invention of God. [5]

My second and much happier qualification is to acknowledge gratefully the English-speaking tradition of Western civilisation to which I belong, the thought world of Shakespeare, Jane Austen and Charles Dickens; Isaac Newton and Charles Darwin; Adam Smith and John Henry Newman; Edmund Burke, William Wilberforce and the Westminster system of government; English common-law and the universities of Oxford and Cambridge. We all have many reasons for gratitude.

Let me explain the peculiarly Christian contribution to Western civilisation by following Pierre Manent, a contemporary French philosopher. For Manent the West was the product of the creative tension, and sometimes fierce conflict, between the "party of nature" — the classical inheritance of Greece and Rome, stressing pride, magnanimity and natural virtues — and the Christian "party of grace", stressing humility, renunciation and the cultivation of the soul. [6]

Manent's claim is that modern man emerged when the tension between these two ancient traditions became open warfare in the 18th century. [7] Modernity and its unhelpfully-named sequel post-modernism regard humans as being above and beyond both nature and transcendence. The two traditional lodestars of God and human nature were rejected, with consequences we are still trying to deal with now. These are the major sources of Western discontent today.

Rejecting the idea that human beings share a constant and irreducible core which makes us human has not only produced massive confusion and incoherence in morals, but helped undermine the concept of human dignity; that each individual possesses an innate dignity, simply by virtue of being human, which must not be violated. In other words, attacks on marriage, family and life produce whirlwinds of discontent across the generations.

This rejection of human nature is at the heart of radical versions of autonomy, individualism and secularism. The propaganda is all about freedom: freedom to choose our own values, and to make and remake ourselves as we please. The reality is a moral relativism that makes evil a question of one's particular perspective or feelings, and a world where human beings become means to others' ends.

Aldous Huxley's Brave New World (1932), with its dim-witted brutes bred for slaves, is still some way away. But our willingness to entertain breeding humans for spare parts (only up to a certain stage for the moment) shows how cheap life has become, and how we threaten to lose our bearings.

Melbourne was visited in recent days by a plague of atheists (I think that's the right collective noun) angrily rejecting an absence. While some have violently rejected Him, for many more God has simply been forgotten. As Alexander Solzhenitsyn observed in his Templeton Lecture in 1983: "If I were called upon to identify briefly the principal trait of the entire twentieth century ... I would be unable to find anything more precise and pithy than to repeat once again: Men have forgotten God". [8]

The consequences of forgetting God have been significant for morality, human dignity, and society in the West. Human beings are no longer made in God's image, but are simply the highest form of animal, whose DNA is 99 per cent identical with that of chimpanzees.

With no eternal destiny there is no danger of judgement in the after-life for our wrong-doings. An enormous effort has gone into pursuing this particular "liberation". As Czeslaw Milosz has pointed out, "A true opium of the people is a belief in nothingness after death—the huge solace of thinking that for our betrayals, greed, cowardice, murders, we are not going to be judged." [9]

Calls by some to reject all religions have been amplified in the wake of Islamist terrorism. But not all religions are the same. Different faiths produce very different societies, as the Chinese specialists with whom we began are now teaching us.

The English historian Christopher Dawson argued that "it is impossible to separate culture from religion", or culture from cult. The biggest mistake that radical secularists and others have made over the last two centuries is to believe that religion is merely "a secondary phenomenon, which has arisen from the exploitation of human credulity". [10] It is impossible to understand the history of the West, or why the West became what it is, without Christianity.

We need to introduce our children to Western civilisation through the teaching of philosophy, history and English literature, in solid rather than debased forms; and edge them towards considering the big questions: Is there truth? What is goodness? Can we believe in beauty?

Knowledge is indispensable but it is never enough by itself. We need to re-present God and the insights about how we should live, which come from recognising our shared human nature. Christians need to challenge intellectually the many agnostics of good will to face up to the absence of alternatives.

Teaching the foundations of Western civilisation is not an intellectual or aesthetic luxury. It is essential to building strong communities and to ensuring that places like Australia remain just and decent societies.

Cardinal George Pell is Catholic Archbishop of Sydney. This article is from a talk he delivered at the Melbourne launch of the Institute of Public Affairs' Foundations of Western Civilisation program on March 25, 2010.

Monday, July 12, 2010

The vagaries of wind farming

Environment
The Great Renewable Energy Rort

Kathy Russell

I thought the message was loud and clear on the Emissions Trading Scheme (ETS) decision: we don’t want one! So why is this same logic not being applied to the Renewable Energy Target (RET) legislation? The proposed Carbon Pollution Reduction Scheme (CPRS) legislation (which incorporated the ETS) was defeated twice in federal parliament, on August 13 and December 2, 2009. After the Opposition blocked attempts to further debate the legislation in February this year, the government announced on April 27 that the implementation of its proposed CPRS would be delayed until at least 2013.

The ETS aimed to create a price penalty for carbon with the overriding objective being to promote carbon abatement. It was effectively a new tax which would artificially inflate our cost of living and most importantly our manufacturing cost base, reduce any shred of international competitive advantage any industry had in this country and essentially ruin a perfectly good economy for no real gain.

On August 20, 2009, the Renewable Energy Target (RET) legislation was passed, requiring electricity retailers and large industrial users to purchase at least 20 per cent of their electricity from renewable energy sources by 2020.

In much the same way as the ETS created a price penalty for carbon, the RET creates a price penalty for electricity in the form of Renewable Energy Certificates (RECs) with the same overriding objective being to promote carbon abatement. The RET is effectively a tax, as was the proposed ETS. By creating a political environment which guarantees uptake of inefficient and very expensive energy forms—for example wind energy—again it artificially inflates our cost of living and most importantly our manufacturing cost base and reduces significantly the international competitive advantage any industry has in this country and essentially ruins a perfectly good economy for no real gain.

Worse still, unlike a normal tax which provides revenue into government coffers for the general provision of infrastructure and welfare to the country as a whole, the RET singularly provides benefit to a select few—renewable energy companies. There is no offset for those forced to bear the cost.

So why the “disconnect” between the ETS and the RET? Aren’t they the same thing? They both have similar objectives with questionable outcomes. Both create artificial markets and costs. Why does the Opposition reject the ETS yet support the RET?

There was a huge public outcry during the ETS debate which motivated the Opposition to act and block the government’s proposed legislation. Is it a lack of public understanding which is allowing the amended RET legislation introduced into parliament in May this year to proceed unhindered? In the interest of greater public awareness, let me expand the concept further with my wind energy example and demonstrate what damage the RET is actually doing in real terms.

Of intermittent nature, wind energy needs 100 per cent backup capacity and the requirement for the market to purchase substitute power when this energy form needs to be shut down due to excessive wind speeds or when the wind dies down. This happens regularly, and details within the live generation data prove it[1]. These “loss of load” incidents have the ability to occur on a grand scale and require intervention from backup facilities at a premium—up to the current market cap of $10,000/MW. Who pays for the added cost of this unnecessary electricity spot market volatility? Yes—you guessed it—individuals (that is, voters) and industry.

In addition, wind energy cannot be substituted for base load, nor can it be relied upon for peak requirements and is classified as self-dispatching. This wind energy supply has a zero bid price into the market, unlike other generators who must compete via price nomination for the opportunity to supply their product. Wind energy drives out the highest price generators first and, as it doesn’t bid into the market, receives the next highest generator’s bid. During periods of low demand, some generators bid a negative price in order to guarantee the uptake of their supply (some energy generators can’t just be switched off). The Australian Energy Market Operator (AEMO) is looking to introduce a floor price into the market in order to accommodate wind energy in this mix. Wind energy does not compete in a free market environment. Its sale and revenue are guaranteed. Who pays for this artificially high price acting over and above normal market forces? Yes—you guessed it—individuals (that is, voters) and industry.

But wait, there’s more. The Renewable Energy Certificates (RECs) which go with the RET are like gold. From a high of approximately $46/MW in March this year, wholesale certificate prices were trading at $38/MW at the end of May[2]. This is the subsidy component which makes the business plan viable and is received on top of the price paid per MW in the dispatch market. Current planning approvals and applications for over 2000MW in western Victoria alone attest to the bonanza to be had. Foreign companies are leading the charge. Profits shift offshore and the underlying cost of the RECs are born by whom? Yes—you guessed it again—individuals (that is, voters) and industry.

Then there are the newly created opportunities to manipulate the electricity market. Destabilise the grid with wind energy and then compensate with fast-acting gas generation at peak prices. Now here’s one for the ACCC to watch. Did anyone notice the most recent capital investments of Origin and AGL to place Open Cycle Gas Turbines (OCGT) in strategic alignment with wind energy investment? Take note of the choice of generator. Combined Cycle Gas Turbines (CCGT—0.4 tCO2/MW) are much more efficient than OCGTs (0.7 tCO2/MW) from an emissions perspective, but unlike OCGTs, they do not have the ability to ramp up and down as quickly. If their investment strategy was to produce gas-generated electricity with the lowest carbon emissions possible, then CCGT would be the choice. If their investment strategy was to produce gas-generated electricity which could take advantage of opportunities in the market via its flexibility in ramping up and down on demand to satisfy grid instability issues, then OCGT would be the choice. Who pays for this fast-acting, shadowing capacity at peak prices? Yes—you guessed it again—individuals (that is, voters) and industry.

And what about the claim of jobs? Australia’s economic recovery on the back of a brave new environmentally friendly world? Construction jobs at the start-up of a wind farm are a given—this is so with the construction of any new plant or industrial facility (including a gas-generating plant) or public infrastructure project. The number of jobs long-term in the wind industry is rather less than ideal. Wind farm control is both electronic/automatic and remotely monitored. Maintenance positions are highly specialised and are not generally filled by local regional communities. Families attached to these specialised technicians don’t tend to relocate to these regional communities as they are moved around different wind farm locations on a rotational basis. The Spanish experience has been that each new green job created cost one million euros and caused 2.2 jobs to be lost in power-consuming industries[3]. Net job losses on the back of reduced economic activity from cost increases in the electricity market—no surprise on this one. Who pays for this unnecessary burden to Australia’s welfare obligations? Right again—individuals (that is, voters) and industry.

And all this for no tangible benefit. Emissions will not be reduced. Not one coal-fired power station will be switched off. Additional back-up capacity will have to be built. Artificially-based capital development of this scale and nature also has the effect of pushing up the cost of borrowing money. An increase in the cost of living and of the manufacturing cost base sends jobs offshore—to the smart countries who don’t entertain fantasies such as RETs and ETSs. Not to mention the vast tracts of land occupied by wind turbines and the destructive effect they have on communities forced to reside with them. This technology type is far from benign. Just ask the communities at Waubra, near Ballarat (and those at Toora, Cape Bridgewater, Capital, Cullerin, Hallet and Crookwell) who are suffering health effects and have started abandoning their homes, creating a new form of epidemic to add to the already struggling health and community support infrastructure. All of this would not be happening if it weren’t for the RET.

But don’t take my word for it. Take the time to listen to other market participants and commentators.

Origin Energy has been doing its best to blow the whistle on the same issues for years. But at what point do they join the rort, given that no one is listening?

In an important speech to the Committee for Economic Development of Australia (CEDA) in Sydney on April 13, Grant King, the CEO of Origin Energy, predicted massive increases in electricity prices driven

largely by the current policy environment, large amounts of renewables being forced into the system, uncosted charges for those renewables given current policy settings and substantial increases in transmission and distribution costs.[4]

In February 2006, Origin Energy submitted a technical paper to the Victorian government entitled “Driving Investment in Renewable Energy in Victoria—Options for a Victorian market-based measure, Submission by Origin Energy in response to the Issues Paper released by Department of Infrastructure and Department of Sustainability and Environment, December 2005”. The reason I mention the detail here rather than in a footnote is because there is a story to tell with regard to this document’s mysterious disappearance from the public domain. Submissions were recorded on the Department of Primary Industries (DPI) website for some years. A Google search now using the key words “Origin Driving Investment in Renewable Energy in Victoria” will produce a number of links to the DPI website. But guess what? When you follow these links, the site opens and a message appears stating that this document has been deleted. Sounds like the “Climategate” response to FOI requests: delete the required information.

But all is not lost. Copies were downloaded when the report was first made available. And their contents make for sensational reading. Some incredibly damning statements are made about the technical viability of policies which promote wind energy (because of its industry maturity) ahead of other developing technologies because of their inability to “step up” and be commercially viable within the time frames demanded.

The following excerpts are important because of their relevance to the argument, and important to acknowledge because so many people either ignore these inconvenient truths and irresponsibly plough on regardless or simply aren’t aware of these basic limitations in the first place.

Unreliable capacity requires additional generation support. Additional wind capacity will require two forms of generation support because of the intermittent nature of the underlying energy source:

variability outside 5 minute dispatch intervals—gas turbine generation, which can take between 15 and 30 minutes to reach maximum output, is either required to run to adjust for wind generation variability or to stand idle as back up support; and

variability inside 5 minute dispatch intervals—ancillary services generation is required, sometimes at significant extra cost, to cater for wind generation variability. [5]

Keep in mind that grid-supplied electricity is a unique commodity; its production for and consumption from the grid must be matched instantaneously and continuously, day and night. Not averaged out over days, hours or even half-hourly intervals. The grid is not like some large lake into which electricity might be dumped. This is an unchanging law about grid operation.

The Origin document goes on:

The costs of both forms of generation support are ultimately borne by energy consumers. Moreover, these costs are magnified as greater amounts of wind generation are connected to the system and more generation support is required. This is compounded by inter-connector constraints from time to time as more generation support is required from other regions in the NEM … 6

The intermittent nature of wind generation translates into higher electricity spot price volatility. Modelling of the impact of 1000 MW of wind generation on the South Australian electricity market indicates that 1 per cent of the time 250 MW of supply could be lost within the half hour and 390 MW within the hour which, in Origin’s view, would significantly increase electricity spot price volatility. Preliminary modelling by Origin indicates that Victorian electricity spot prices could increase by between $2 and $5/MWh (average flat price impact) as a result of a similar level of variability occurring in Victoria. The cost of additional financial risk associated with greater electricity spot price volatility will ultimately be borne by energy consumers. [6]

The fact that wind energy supply can be lost in such a short period is no joke. Commentators who make assertions to the contrary appear blissfully unaware that the performance data of all major wind farms connected to the eastern Australian grid is readily available in the public domain[7].

To demonstrate that a widespread loss of wind generation can and will occur, the night of August 18, 2009, provides a perfect example. Very strong prevailing winds of a weather system covering the Cullerin and Capital wind farms in New South Wales (about 40 kilometres apart) caused the control systems of both wind farms to shut down the wind turbines for their own protection. Each wind farm had been operating near its rated full capacity of approximately 120 MW combined, which fell to zero within two minutes, starting at 5.19 p.m. This is a very significant loss that had to be replaced immediately.

The Origin document continues in its criticism of policy which promotes renewable energy such as wind over more economic forms of greenhouse gas abatement:

The economic cost of gas-fired generation is lower than wind generation—the combined capital and running costs of a gas-fired power station are approximately half that of a wind turbine (adjusted for the intermittency of wind and including higher running costs of running a gas-fired power station);

Gas-fired generation is a more cost-effective source of greenhouse gas abatement than wind generation—at approximately half the economic cost, a gas-fired power station reduces emissions up to twice as much as a wind turbine, because of the better utilisation of the gas-fired power station and the relatively low emission intensity of gas-fired electricity (which makes gas at least 4 times more cost-effective on a $/tCO2 basis than wind);

Gas-fired generation is more reliable than wind generation which is reliant on the vagaries of nature—gas-fired generation can be turned off and on to meet demand requirements while wind generation is regarded as firm for about only 8 per cent of the time (according to ESIPC in South Australia);

Gas-fired generation can provide much larger increments to generation capacity to satisfy growing demand—a large scale gas-fired power station may be up to 1000MW which is all available to generate on average 95 per cent of the time compared to a 1000MW of wind generation which is available to generate on average 33 per cent of the time; and

Diversity and security of supply are improved by gas-fired generation and diminished by wind generation—gas-fired power stations stimulate gas supply sources (potentially expanding the range of viable gas production in regional Victoria available for other uses) and connect to the transmission system (potentially in more remote areas) without lowering supply security (as would be the case with wind)[8]

Pretty damning isn’t it? So why isn’t the government listening?

A lack of transparency coupled with an absence of any analysis of live performance data in assessing the effects of policy in real terms from the highest levels down are contributing to these enormous mistakes.

In an effort to combat the lack of transparency and non-availability of live performance data, Andrew Miskelly has, of his own initiative, developed a way to make electricity generation data more freely available and user friendly (see the website). Why has this task been left for unpaid “privateers” to complete?

The electricity provided to the national grid by every connected generator of greater than 30 MW installed capacity is published daily on its website by the AEMO, the operator of the eastern Australian grid. It is a statutory requirement that the data is made available in the public domain. At www.aemo.com.au there is the statement “under Clause 3.13.4(r) of the National Electricity Rules AEMO is also required to publish such data to Registered Participants, in a daily file covering all intervals of the previous trading day”. In fact, the data is supplied to the website as the average output at five-minute intervals for each full day, midnight to midnight, at about 4 a.m. the following morning, every morning. Andrew has created a method which captures this information release.

On the back of this original information breakthrough, Andrew and Dr Tom Quirk teamed up to write a paper which debunked the myth of geographical dispersion[9]—the myth being that wind farms can be a reliable source of electricity if they are dispersed over a sufficiently wide area[10]. The wind will be “blowing somewhere”, it is claimed. Given the real production output of wind farms in South Australia, New South Wales, Victoria and Tasmania, Andrew and Dr Quirk analysed the data and were able to determine that wind farms in south-eastern Australia are unlikely to supply any significant power output that system operators can rely on. Using five-minute power measurements for the month of June 2009, it was determined that the one benefit of grouping wind farms is that the 90 per cent reliability point is increased from 6 per cent for South Australia, 5 per cent for Victoria, to 10 per cent overall. This figure should be expected to vary from month to month and from year to year as a result of changing weather patterns with no marked improvement as a result of saturation of wind turbines within respective states.

Since the Miskelly/Quirk paper was written, there have been a number of sustained meteorological events which highlight even further the obvious fallacy of geographical dispersion. The period November 1 to 21, 2009, was of particularly low output across the whole eastern Australian grid. More recently, May 13 to 20 paints a terrible output generation picture if you’re a wind farmer. The operational data originally posted on the AEMO website for these date ranges is available via Andrew’s www.landscapeguardians.org.au/data/aemo database. Also, go to http://windfarmperformance.info/ and alter the “change date” tab and flick through the May date range provided to confirm the graph below.


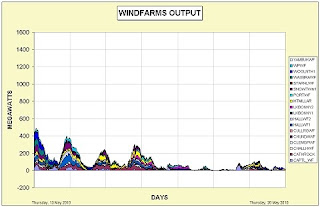
The above combined wind farm output incorporates all of the wind farms over 30 MW capacity which are connected to the eastern Australian grid and are listed to the right of this graph. This equates to a total installed capacity of 1611 MW. If this maximum potential output were to be demonstrated on the above graph, it would appear just above the 1600. As previously mentioned, not a good week if you’re a wind farmer. So much for the certainty of geographic dispersion improving wind farm reliability.

Wind farms on the eastern Australian grid have a geographic spread of over 1100 kilometres east-west and over 500 kilometres north-south. This grid has the largest geographic dispersal of any interconnected grid in the world. Weather systems can occupy and influence large if not whole areas within this geographic spread[11]. Further, no matter how many turbines are erected throughout this geographic area, wind energy will always require instantaneous reserves equal to the total installed wind farm capacity to be kept operational at all times. This reserve requirement is in addition to any reserves presently required to cover the loss of any large controllable generation unit, simply because the scenario that a large generation unit (such as a coal power station) might fail remains a separate, independent probability to that of wind farms’ frequent “failures”.

Furthermore, Andrew’s data base provides conclusive evidence that wind farm output does suddenly start and stop on a regular basis, and does so in a totally unpredictable fashion. This data cannot be averaged out for the purpose of analysing wind farm performance and its ability to supply a secure, reliable, efficient energy source into the grid. To do so completely ignores that unchanging law of grid operation, where supply and demand must be matched instantaneously and continuously, all the time. Not averaged out over days, hours or even half hourly intervals. This unpredictability may well have serious impacts on the controllability and stability of the eastern Australian grid.

It is impossible to forecast wind speeds and wind speed variation over timeframes of seconds to minutes, or to provide any sort of accurate estimate of wind speed variation across the meteorological micro-scale of any given wind farm location. It is possible to forecast some sort of regional mean wind speed (that is, average value) over timeframes of hours. But again, averages are not good enough when it comes to managing the grid second by second. Thus the flow-on effects such as market volatility, higher electricity prices, grid instability, security and efficiency issues become an everyday reality if the current RET policy promoting wind energy remains unchallenged.

And how is this totally unacceptable risk being justified by our incumbent governments? At a state level in Victoria I received a letter on the subject from the Office of the Minister for Energy and Resources, signed by the Chief of Staff, Ms Susanne Legana, dated November 17, 2009:

Regarding the intermittency of wind, this is partially mitigated by the installation of multiple wind farms, as together these smooth out individual variability. In 2007, there was a period of only about 4 hours where the combined output of wind farms in Victoria was zero.

God love her! This was November 2009, mind you, and Susanne was quoting 2007 data. Not only this, but Victoria, South Australia and New South Wales were at that exact moment in the grip of extremely calm weather. In the first three weeks of November there was a total of 5.5 hours in which the combined output of wind farms in Victoria was zero or below (important fact: sometimes turbines are net users of electricity because at all times they require energy to initiate and maintain blade spin, cooling of motors, remote monitoring, turning of blades to face the wind, flashing lights, and so on). In addition, for a further 5.67 hours the combined output of wind farms in Victoria in this period was between zero and 1 MW. This is just as bad. What good is 1 MW of power from all that capacity? On top of this again, for a further 26.25 hours the combined output of wind farms in Victoria in this same time frame was between 1 and 5 MW.

That’s a total of 37.42 hours of less than 5 MW Victorian combined wind farm energy generation during a three-week period from a combined maximum generating capacity of 439 MW. So for a day and a half in a three-week period, all the wind farms in Victoria combined produced less than 1 per cent of their capacity. How is this smoothing out intermittency? How is this energy security? How is this timely analysis of live data? The Office of the Minister for Energy and Resources is two years behind!

In total, the system produced at less than 50 MW for the equivalent of eight days. It produced at less than 100MW for the equivalent of thirteen days. The average output for the whole Victorian system for the three-week period was 86.32 MW. It peaked at 341 MW at 11.05 a.m. on November 3 during one of two days of elevated activity. I must reiterate that it is very important not to rely on averages alone when analysing this data. Big movements from minute to minute are not the exception, but the rule. On November 3 at 4.10 p.m. the combined system was producing 306.07 MW; at 4.15 it was producing 290.445 MW; at 4.20 it was producing 274.28 MW; at 4.25 it was producing 258.21 MW. This was a loss of 47.86 MW within fifteen minutes. This is not an isolated incident.

Now imagine a further 2000 MW installed capacity within this Victorian system as per approved and planned applications. Assuming a total capacity of 2439 MW, a variance of 11 per cent capacity in fifteen minutes would translate to a loss of 268 MW from the system. This type of event will occur regularly.

On the same day at 03:05 a.m., 77.27 MW was lost in ten minutes; at 4.50 a.m., 80.43 MW was lost in twenty-five minutes; on a further six instances on the same day 10 per cent or greater capacity was lost within minutes. And this isn’t counting the equivalent increases being forced into the grid. Multiply this out against a larger installed capacity as is intended for the state and this is the equivalent of a large gas-fired generator being switched on and off regularly. The operator of a gas-fired generator would be fined hundreds and thousands of dollars if it were to perform in this manner. The wind generators get away with this behaviour.

So can you now see why backup generation must not only be built, but kept running at all times? What’s the point of installing two systems when one alone will suffice? Where are the savings?

Frightening isn’t it? And the people managing and governing our country are not analysing this data and therefore do not have a clue what effects their policies are having in real terms. The ignorance gets worse. Note the following paragraph from the same letter:

Wind farms are private sector investments which derive income from two sources, the sale of electricity and the sale of Renewable Energy Certificates (REC). Private investors would not continue to develop wind energy projects if they were not commercial in competitive electricity and REC markets.

If the Office of the Minister for Energy and Resources were private enterprise, the Board and the CEO would be sacked. Where is the accountability of the Australian government? Wind energy does not compete in the electricity market. It drops in and takes the next available bid price. And no, the private sector wind farm investor is not happy with the current competitive nature of wind versus solar in the REC market, and that’s why they have lobbied Penny Wong, federal Minister for Climate Change, Energy Efficiency and Water so intensively to have their own market in which they do not have to compete. Thus the new RET legislation currently before the parliament. New wind energy gets electricity price plus REC value with no requirement to compete. New gas energy gets electricity price only plus has to compete for opportunity to supply. Hello? Who’s driving this bus?

Contrary to the belief of the Minister for Energy and Resources that wind farms would not be built if they weren’t able to compete in the electricity and REC market is the unavoidable fact that private investors are applying in their droves for new wind farm developments due to current friendly policy which removes the risk of competition and guarantees cash windfalls. And it’s our money the government is using as bait to achieve their political objective of being “seen to be green”.

Departments such as the Energy and Resources Department quite clearly do not have a clue. They lack a basic understanding of industry dynamics, with no level of accountability or responsibility, and there is no intelligent, transparent analysis or debate behind their decision making.

A blind faith in RET legislation and an ETS being able to solve all of these issues is driving this madness. A blind faith in a Green utopia which decrees “in theory” (confirmed by computer modelling?) that we must have a generous mix of all energy types with a magical “20 per cent renewable” falling out at the end of the equation. And an even blinder faith which assumes we can acquire all of these different energy types off the shelf and simply plug them into our current electricity grid, ready to use. In Australia, we are not connected to any neighbouring countries which have the luxury of fast-acting secure conventional backup generation capacity (such as nuclear, hydro, gas and coal) as is the European experience. Why are these basic facts being ignored? If the system is going to be forced to work in an inefficient manner for no gain (and that includes little if any carbon abatement), we have a right to know: “At what cost?”

The damage does not end here. Environmental costs of equal if not greater significance must also be included in this analysis. The most significant of all is the human cost.

Human health is an issue of major concern for those forced to reside near turbines and for good reason. I know because I speak and correspond with these people every day. I know because I am invited into their homes and for the relatively brief length of my stay, I experience their symptoms. Luckily for me, I am able to leave, and in doing so my symptoms disappear. Not so lucky the people who can’t leave and are forced to endure long-term exposure with significant long-term consequences. Some have been fortunate enough to have the means to leave their homes. The majority are not so lucky, having lost the ability to sell their most valuable asset, their farm or home.

Symptoms range in strength and severity and include sleep disturbance, motion sickness and nausea, inner ear symptoms, headaches and migraines, excessive tiredness, palpitations, high blood pressure, eye symptoms, and cognitive as well as gastrointestinal problems. The residents of some homes experience more problems than others, and sometimes certain family members within these homes are affected more than others. Explanations for these differences include a combination of an individual’s physical predisposition, distance from the wind farm and climatic conditions which affect the operation of the turbines at the time.

In a rather clever analogy, a Waubra resident recently compared her experiences of ocean racing with those of living next door to a wind farm. She said in ocean racing, some of those on board the same boat would fall ill to seasickness immediately and be totally incapable of moving for the remainder of the journey, some would be ill yet could still function, while others felt no ill effects at all. Much the same happens around a wind farm, although the biggest concentration of people affected in Australia appears to be at the Waubra wind farm site, north-west of Ballarat. Unlike ocean racing, where a seasickness sufferer is given sympathy and accommodated in their reduced capacity, those suffering wind farm sickness are ridiculed by wind company managing directors[12] and their genuine concerns are ignored by those who are supposed to at the very least initiate investigations, support and protection—the government and its delegated agencies.

Sound familiar? Parallels with the tobacco and asbestos histories come to mind— misrepresenting data, hiring PR firms, attacking the detractors. Remember, there is a great deal of money and green votes at stake here.

In response to a Legislative Council adjournment debate issue raised by Peter Kavanagh MLC in the Victorian parliament on September 2, 2009, in relation to the possible health effects of wind farm generators, on October 14 the Minister for Workcover Tim Holding announced: “WorkSafe has commenced work with the Department of Human Services (DHS) and the Environment Protection Authority, and will work with local government and relevant individuals to identify potential hazards related to the issues raised by Mr Kavanagh.”

In January, Mr Holding announced the conclusion of his investigation with the finding that after examining both peer reviewed and validated scientific research, no correlation could be found between direct health effects and the operation of wind turbines. However, not one resident who had raised their concerns with the wind company was interviewed or even approached as part of this investigation.

On November 11, I participated in the National Wind Farm Development Guidelines: Stakeholder Reference Group (SRG) meeting. The meeting was called to discuss what the working group had planned for the consultation process for the draft National Wind Farm Development Guidelines, the timeframe for analysing the public comments and addressing those comments in the final version. It was expected that the SRG would provide a diverse range of views and highlight issues that the Working Group could address during and after the public consultation period. It was an experience to say the least.

Of greatest concern to me was the stated purpose of the guidelines: “to support government renewable energy policy by providing a nationally consistent set of methods for addressing issues that are unique or significant to wind farms”[13] (emphasis added). Beside the fact that the wind companies present at that meeting decreed that they would not follow guidelines which were not a legislative requirement (so what was the point of having a nationally consistent set of guidelines?), there was no mention of health effects in any of the chapters or appendices. As far as I and the hundreds I represented at that meeting were concerned, health was a major subject “unique or significant to wind farms”, yet there was no mention or recognition of it, let alone a guideline on the subject. How could potential safeguards be put in place if the problem itself was not recognised? By not acknowledging the problem, were we not condemned to more of the same mistakes?

This was quickly countered with the “no peer-reviewed evidence” excuse during the ensuing debate. But during a subsequent break, the convenors (from the Department of the Environment, Water, Heritage and the Arts, DEWHA) approached me and explained that until there was evidence of a conclusive scientific peer-reviewed nature, they couldn’t act. But if I was to obtain something of significance, I should provide it to them and I would be assured of the subject’s recognition. Yeah, right. Quite clearly, the state and federal governments had no intention of initiating the scientific studies required to investigate the causal links. Given this was a new frontier in scientific research, the cost, resources and expertise required to complete the task were extensive, so how was this the responsibility of ordinary Australians? Wasn’t it the government’s responsibility to at least send in an assessment team to interview and investigate the people affected?

Rather than rely on the assertions of DEWHA employees, I then moved on to Peter Garrett, federal Minister for the Environment, Water, Heritage and the Arts (the position he held at that time). I was beginning to understand in explicit detail how the pink-batts tragedy had evolved. On February 18, 2010, I met with Mr Garrett and took with me a Waubra resident who was suffering health effects and had been forced to move out of his home. I also took and provided to Mr Garrett a short documentary of the testimonials provided by other Waubra residents who were unable to attend the meeting. We also provided medical evidence and expert advice, some of which was personally addressed to Mr Garrett. On the issue of health and its omission from his National Guidelines, Mr Garrett contended that he had no jurisdiction in this area and it was the responsibility of the states. He stated he had jurisdiction only under the Environment Protection and Biodiversity Conservation Act (EPBC Act). When asked why he was writing National Guidelines which included subjects such as noise, shadow flicker, electromagnetic interference, aircraft safety, fire risk, if he had no jurisdiction in these areas, he would not respond.

I then introduced Mr Garrett to the Waubra resident who had been displaced from his home. I took the evidence to him. There was no show of concern on Mr Garrett’s behalf, no request for this man to relay his story so that he could at least make his own assessment. Just an assistant next to Mr Garrett pointing out the necessary response in the response book: “there is no peer-reviewed scientific evidence to support the link”.

We left Mr Garrett with some very fundamental and damning evidence which at the very least would be grounds to commence an initial assessment. He promised to respond personally. To this date (June 1) we have not received any correspondence, let alone a response to the information we provided. Unlike the pink-batts scandal, he can’t say he wasn’t warned of the consequences to people’s health on the wind farm issue.

Given Mr Garrett’s perception that health was a state government responsibility, on March 15 I attended a Victorian State Community Cabinet meeting in Geelong. With me I took a number of other Waubra residents as well as residents from other wind-farm-approved locations who would soon be affected by turbine operation near their homes. We all wanted answers. The ones we got were quite unexpected.

First, the Premier, John Brumby, had no idea that his wind farm policy mandated use of a New Zealand noise standard. Mr Brumby and Mr Batchelor (Minister for Energy and Resources) equally had no idea that any national standards or guidelines, if and when they were released, would have no jurisdictional power in Victoria over their mandated New Zealand standard.

The most telling answer of all was Mr Batchelor’s response to Waubra residents when they relayed to him what was happening in their own homes: it was up to them to prove there was an issue with scientific peer-reviewed evidence to back up their claims, because the wind companies had been granted development approval through the proper channels and it was hardly fair that they should have to change their practices just because someone complained. When he was told that it wasn’t just one person complaining and an investigation should be the government’s responsibility, Mr Batchelor used the same old excuse, “there is no peer-reviewed scientific evidence to support such a study”.

How on earth can they make this determination when not one incumbent government minister or their representatives or agencies will even visit Waubra, let alone speak with the residents? After all this (and much more)—you have to ask yourself: Why?

There are only two possible answers to this question. Either it is true that there is no connection between health and wind turbines and the people I have personally surveyed in Waubra and the people making similar claims at other wind farms in Australia and throughout the world are imagining them, or ...

... the ramifications of undertaking such a study and finding a connection are too great from the perspective of either litigation (with the potential to destroy the wind industry in Australia and any chance of achieving the RET’s 20 per cent renewable target by 2020) or planning scheme adjustments (which would recognise and prevent health issues and thus severely alter the locations at which wind turbines can be placed, again jeopardising the 20 per cent renewable target by 2020).

Either way, there is obviously a great deal at stake here, which the government and the wind industry are keen to keep a lid on. Ultimately a proper study which satisfies the current scientific peer-reviewed criteria is required to determine an outcome either way. The government has a duty of care and it should fulfil this obligation.

On May 20, we met with the state Liberal Opposition leader Ted Baillieu, who had the week before released a wind farm policy in the lead-up to the state election in November. Amongst other things, his policy mandates a two-kilometre setback of turbines from homes (currently there are no planning setback provisions, with homes unwillingly as close as 400 metres in some approved developments). We took this one step further with Mr Baillieu and sought his opinion on the necessity of an approved health study. His opinion was in the affirmative and he later confirmed this affirmation at the media conference on the steps of Parliament House in answer to a direct question on camera. A Ballan resident with turbines proposed within a kilometre of her home who was not part of the earlier meeting but was there to listen to Mr Baillieu speak, burst into tears on hearing this news. Such was her relief. Again I ask the question: “At what cost?” We have a right to know.

From the work I have undertaken on the health issue with experts to date I have a fair idea of what is contributing to the problem from a physical and planning perspective. I don’t believe there is a single contributing factor or a single available solution. I do believe that what can’t be acknowledged can’t be changed. I do believe without a question of doubt that this is an avoidable problem. I do believe without a question of doubt that the same mistakes are being made in current planning approvals via policy which will guarantee the displacement of hundreds more rural residents situated close to turbines through no fault of their own. I don’t care if my hypotheses of contributing factors or suggested solutions are wrong, as long as someone determines what they should be and fixes the situation before more innocent rural families are subjected to the same form of torture as those currently suffering.

The moral high ground taken by those in government and those initially in favour of turbines is that they are doing their bit for the environment. People not wanting turbines in close proximity to their properties or homes are considered collateral damage by the very planning process established to protect them. Any risk or resulting damage is not costed in its assessment of “benefits to the greater community”. And then these people discover that they are being sacrificed for no real gain—that their loss and harm will not contribute to saving the planet.

This is what the Renewable Energy Target is doing to real people in real terms, right now. Why is anyone of sound mind supporting this legislation?

Kathy Russell, a Member of the Institute of Chartered Accountants in Australia, is Vice-President of Australian Landscape Guardians Inc, whose website www.landscapeguardians.org.au contains some of the data referred to in this article. She lives in rural Victoria.


[1] Data available via the Australian Landscape Guardians website; www.landscapeguardians.org.au

[2] Green Energy Markets, www.greenmarkets.com.au

[3] Juan Carlos University, “Study of the effects on employment of public aid to renewable energy sources”, March 2009

[4] Terry McCrann, “Your power bills will triple”, Herald Sun, 15 April 2010

[5] DRIVING INVESTMENT IN RENEWABLE ENERGY IN VICTORIA - Options for a Victorian market-based measure, Submission by Origin Energy in response to the Issues Paper released by Department of Infrastructure and Department of Sustainability and Environment, February 2006, page 10

[6] “DRIVING INVESTMENT IN RENEWABLE ENERGY IN VICTORIA”, by Origin Energy, February 2006, page 11

[7] Data available via the Australian Landscape Guardians website; www.landscapeguardians.org.au

[8] “DRIVING INVESTMENT IN RENEWABLE ENERGY IN VICTORIA”, by Origin Energy, February 2006, page 13

[9] Miskelly A and Quirk T, “Wind Farming in South Eastern Australia”, Energy and Environment, Volume 20 No.8 2009/Volume 21 No.1 2010, Multi Science Publishing Co. Ltd.

[10] Diesendorf M. The Base-Load Fallacy. http://www.sustainabilitycentre.com.au/BaseloadFallacy.pdf

[11] Anon. 2009 State of the Energy Market 2009. Australian Energy Regulator, page 72, available for download at http://www.accc.gov.au/content/index.phtml?itemId=904614

[12] Brett Thomas, Managing Director, ACCIONA, letters to the editor, Geelong Advertiser, 14 September 2009.

[13] Draft National Wind Farm Development Guidelines, http://www.ephc.gov.au/taxonomy/term/25, page 7.